Unlocking Market Share Insights in Power BI: A Comprehensive Guide
Written on
Understanding Market Dynamics
In the current data-centric environment, grasping market dynamics is vital for making strategic business choices. Power BI, a robust analytics service by Microsoft, serves as an invaluable asset for extracting insights from data. This article will explore how to calculate market share effectively using Power BI.
Key Highlights:
- Data-Driven Decisions: Grasping market dynamics is crucial for informed decision-making.
- Power BI: A multifaceted tool for insightful data visualization and analysis.
Advantages of Utilizing Power BI:
- Advanced Visualization: Convert raw data into actionable metrics.
- Analytical Strengths: Uncover opportunities across various market segments.
This guide is tailored for both experienced data analysts and business professionals eager to refine their analytical capabilities. By the end of this article, you will learn how to create a detailed market size table that empowers you to make informed, data-driven decisions.
Target Audience:
- Data Analysts: Enhance your analytical skills.
- Business Professionals: Make strategic decisions grounded in data.
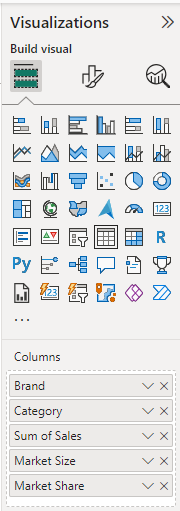
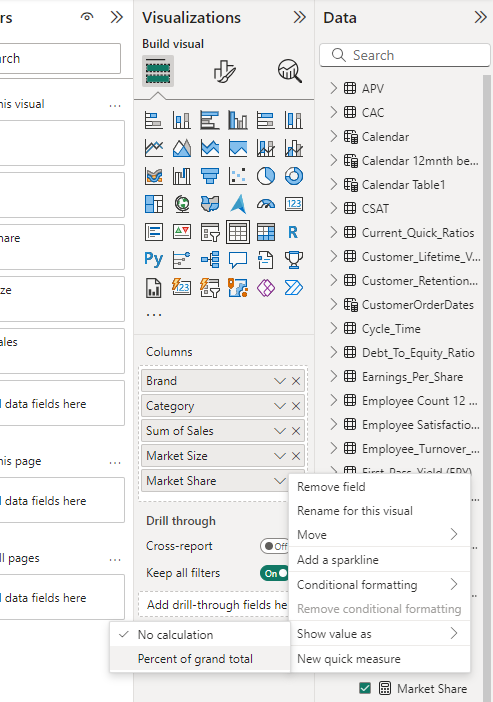
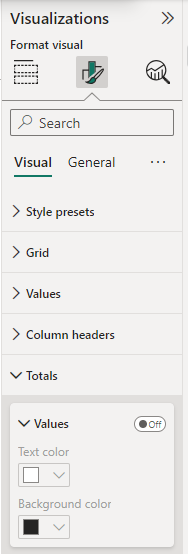
In this piece, I will provide a detailed walkthrough for creating a table visual in Power BI, including a dedicated column for market share.
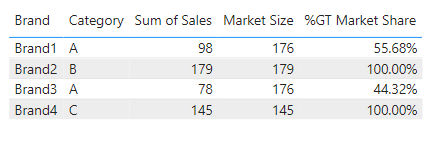
The final outcome will resemble the following table:

1. Understanding the Data Table
We will refer to the following table for calculating market share:
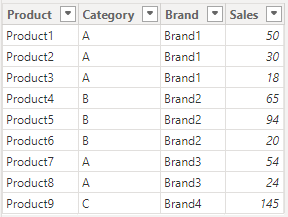
Market_Share Table Overview:
- Product: Lists individual products (e.g., Product1, Product2).
- Category: Groups products into categories (e.g., A, B, C).
- Brand: Identifies the brand linked to each product (e.g., Brand1, Brand2).
- Sales: Displays sales figures for each product.
Key Observations:
- Category A: Brand1 offers three products with sales of 50, 30, and 18. Brand3 has two products with sales of 54 and 24.
- Category B: Brand2 features three products with sales of 65, 94, and 20.
- Category C: Brand4 has a single product with sales totaling 145.
This table is instrumental in visualizing the sales distribution across diverse products, categories, and brands, offering a comprehensive view of market performance.
Sample Calculation
For products in Category A, the total sales amount to (98+78) = 176, which represents the market size.
For Brand 1 in Category A, the market share is computed as (98/176)*100 = 55.68%, while for Brand 3, it is (78/176)*100 = 44.32%.
Conclusion
Thank you for your attention! Feel free to follow or subscribe to stay updated with my Power BI articles.
Shashanka Shekhar - Medium
Explore insights from Shashanka Shekhar on Medium. A contributor focused on Microsoft Power BI, passionate about Data Analysis.
Don’t forget to subscribe to:
- Power BI Publication
- Power BI Newsletter
Join our Power BI community through the Power BI Masterclass.
